
For beverage distributors
Portfolio intelligence for brands you manage
Shopra turns thousands of rows across shipments, depletions, retail performance, incentives, and supplier investments into clear actions.
How it works
Every supplier and brand in one portfolio view.
The problem
Your brand managers are doing analyst work.
The data for every supplier and brand exists, but it lives in thousands of rows across shipments, depletions, retail performance, incentives, and supplier investments.

The portfolio is hard to see at once
Which brands are growing efficiently, which are missing targets, which investments are low ROI, all buried in spreadsheets.

Waiting on analysts or drown in reports
The time that should go to helping suppliers grow goes to building the report instead.

Problems surface late
Declining POD counts, supplier deterioration, retail execution issues, and inventory concerns show up after they cost you.
The workflow
See the whole business in one place
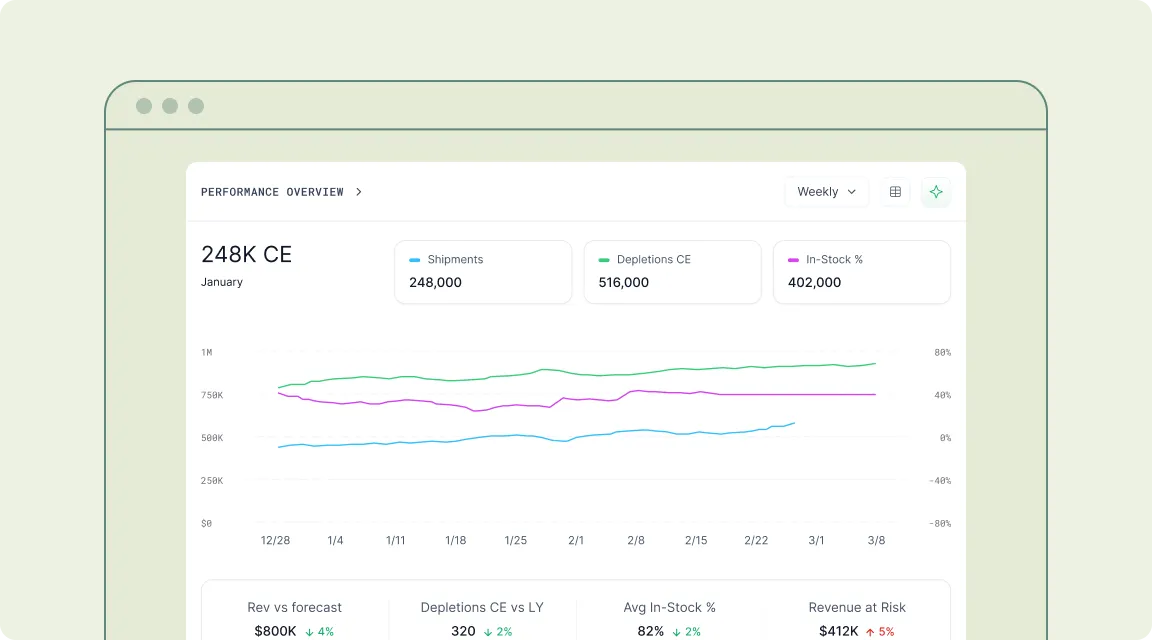
Once your data is connected, the work gets simple. See depletions with their drivers and drags, keep distributor performance visible, catch retail gaps before the shelf empties, and let the reporting run itself.
distributor
Hold distributor performance visible
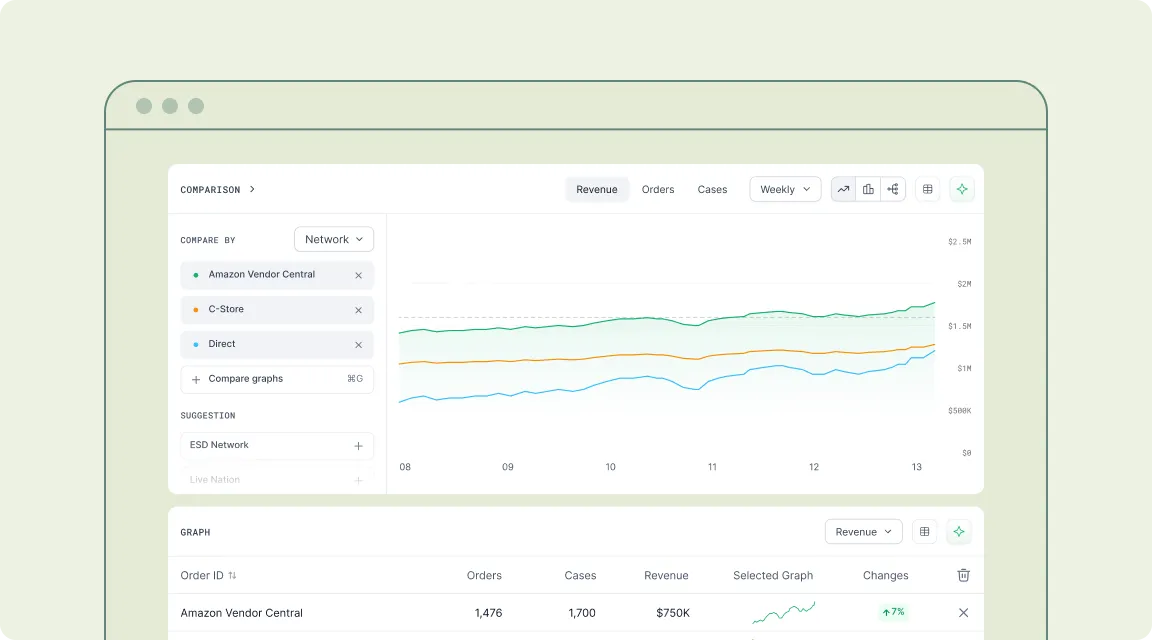
Shopra combines shipments, depletions, retail performance, incentive spend, marketing investment, and distribution growth so the cause is clear, not just the trend.
inventory
Get opportunities detected for you
Shopra flags high spend with low growth, high profit with low distribution, declining POD counts, supplier deterioration, retail execution issues, and inventory concerns, and every alert includes a recommended action.
alerts
Act on proactive alerts
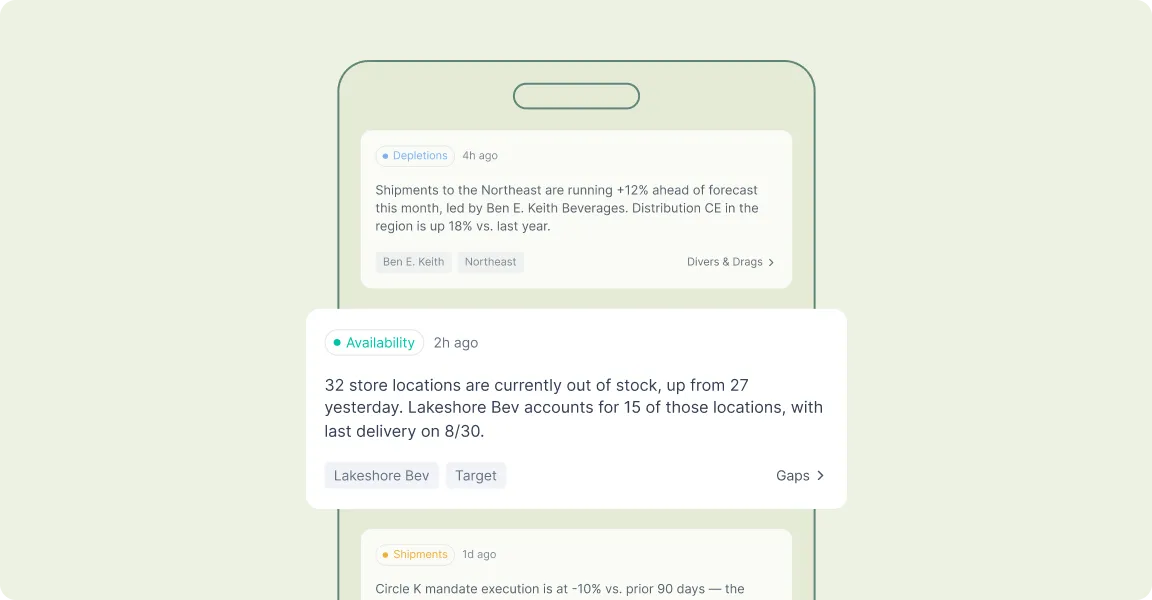
Stock rates trending down, POD declines, supplier or rep performance slipping, low ROI spend, missed targets, and distribution opportunities arrive in your inbox.
Built for every team
Give every team the same picture
Whoever owns the forecast, the distributor relationship, or the data model gets the view they need, all from the same numbers.

Sales ops and leadership
Prioritize accounts, surface trends before the monthly report, and walk into reviews with the answer already in hand.

Distribution and field teams
Spot at-risk orders with revenue impact, track the daily order tracker against forecast, and drill into any distributor, retailer, product, or person.

BI and data
Get a clean, harmonized model in a warehouse you own, with direct warehouse access and role-based controls, instead of another black box.
See your portfolio in a new way
The difference
Built on a foundation, not just dashboards
One harmonized source of truth
We unify shipments, depletions, distributor inventory, and retail scan into one model, so the numbers finally agree across every team.
An intelligence layer
Shopra connects the data and surfaces what is driving and dragging the business, with the drill-down behind every number on product, distributor, retailer, and person.
A warehouse you own
Your data lives in a dedicated Google Cloud warehouse that you own, with role-based access controls and direct warehouse access. Your data stays yours.

Integrations
Connect the sources you already run on.
Shipments, depletions, distributor inventory, and retail scan flow in through a mix of near real-time integrations and 24-hour SFTP exports and ingestion, including VIP and Encompass, plus API access and a fast agent backend for querying.


Your data stays yours. Dedicated Google Cloud warehouse, owned and controlled by you.
jump ahead
Frequently asked questions
The things most distributors ask us before they start. Can't find your answer here Get in touch.
Keep them, they run your operations. Shopra sits on top as the intelligence layer, combining depletions with supplier spend, retail performance, and ROI so brand managers see the whole portfolio in one grid instead of thousands of rows.
No. Your data lives in a dedicated warehouse that only your organization can access. There is no shared database, and nothing is visible to suppliers, other distributors, or anyone else.
No. The data arrives cleaned and modeled, so a brand manager gets answers directly: which brands are growing efficiently, which investments are earning back, which accounts need a call. Your analysts keep direct warehouse access for everything deeper.
Dashboards from your own files work right away. For live data, you pick your connections, your route accounting system, your ERP, your retail feeds, and they start flowing.
Uploads are as fresh as the file you drop in. Most live connections sync almost instantly, and a few sources only publish updates every 24 hours. The numbers you open in the morning are that morning's numbers.
You do. It lives in a dedicated Google Cloud warehouse your organization owns, with role-based access controls and direct query access. If you ever leave, the data goes with you.
ready when you are
Turn your data into your next move
See your drivers, your drags, and where to act today.
Get a demo
.webp)

