Free Excel template
See where your cases are sitting with the SDS Triangle
A free Ship, Deplete, Scan tracker for Excel. It lines up what you shipped, what distributors depleted, and what scanned at retail, week by week and SKU by SKU, with days-on-hand and under-ordering flags already built.
What is the retail triangle?
The retail triangle is the gap between three numbers that describe every case a beverage brand sells: what you shipped to distributors (sell-in), what distributors depleted to retail accounts (sell-through), and what scanned at the register (sell-out). The three almost never agree in the same week, and the gaps between them show where your cases, and your cash, are actually sitting.
Shipments well above depletions means distributor warehouses are filling up. Depletions well above scan means back rooms are filling up. When all three track each other, the pipeline has converged and you are selling what you ship.
What's in the SDS Triangle?
| Tab | What it does |
|---|---|
| Setup | Your SKUs, distributors, banners, units per case, CE per case, and days-on-hand targets |
| Ship | Cases shipped to each distributor, one row per week per SKU |
| Deplete | Cases depleted by each distributor to retail accounts |
| Scan | Units sold at retail, from your POS or scan provider |
| Tracker | Every column is a formula: CE, cumulative volume, inventory, days on hand, and flags |
| Summary | Latest-week snapshot, by-SKU rollup, and the three lines by week |
How does the tracker calculate days on hand?
Distributor inventory on hand is your opening inventory plus everything shipped to date minus everything depleted to date. Days on hand divides that by the daily depletion rate over the last 4 weeks (depletions divided by 28 days). It stays blank until 4 full weeks of history exist, because a partial window understates the rate and flatters the result.
How does it flag under-ordering?
The flag fires only when two things are true at once: the distributor ordered less than 95% of what it depleted over the last 4 weeks, and days on hand has already fallen below your minimum target. Either signal alone is noise, since a distributor is allowed to draw inventory down. Both together means the distributor is running the shelf toward empty without reordering to cover it.
How do you read sell-in vs sell-out?
The tracker divides depletions by scans over the same 4 weeks, after converting both to case equivalents (CE):
- Above 1.0: you are pushing more into retail than shoppers are buying, so inventory is piling up in back rooms.
- Below 1.0: retail is selling faster than distributors deliver, so out-of-stocks are a risk.
- Near 1.0: the triangle has converged.
How to use it
- Open Setup and replace the sample SKUs, distributors, and banners with your own. Set your days-on-hand targets.
- Paste your data into Ship, Deplete, and Scan. Ship and Deplete are in cases, the way distributor reports arrive. Scan is in units, the way POS reports arrive.
- Open Tracker. Every column recalculates. Add one row per week per SKU to extend it.
- Open Summary for the latest-week snapshot and the by-SKU rollup.
What the sample data shows
The workbook ships with a fictional three-SKU launch into two distributors over 13 weeks, so every SKU starts at zero inventory:
- Under-ordering: one SKU is pipeline-filled in week 1, then the distributor stops reordering. Days on hand bleeds from 29 to 22 and the under-ordering flag fires before orders correct.
- Healthy: one SKU's ship, deplete, and scan track each other all quarter, and days on hand holds in the low 30s.
- Over-shipped: one SKU was over-shipped at launch and retail demand never showed up. Days on hand climbs past 160, roughly five months of stock in a warehouse.
SDS Triangle vs Shopra
| This template | Shopra | |
|---|---|---|
| Ship, deplete, and scan side by side | Yes, pasted weekly | Yes, refreshed every morning |
| Days on hand and under-ordering flags | By SKU | By SKU, distributor, and account |
| Item codes and units harmonized | You set CE per case | Automated across ERP, VIP, Encompass, and scan |
| Forecast and last year alongside | No | Yes, with drivers and drags behind each miss |
| Effort each week | Download, paste, check | None |
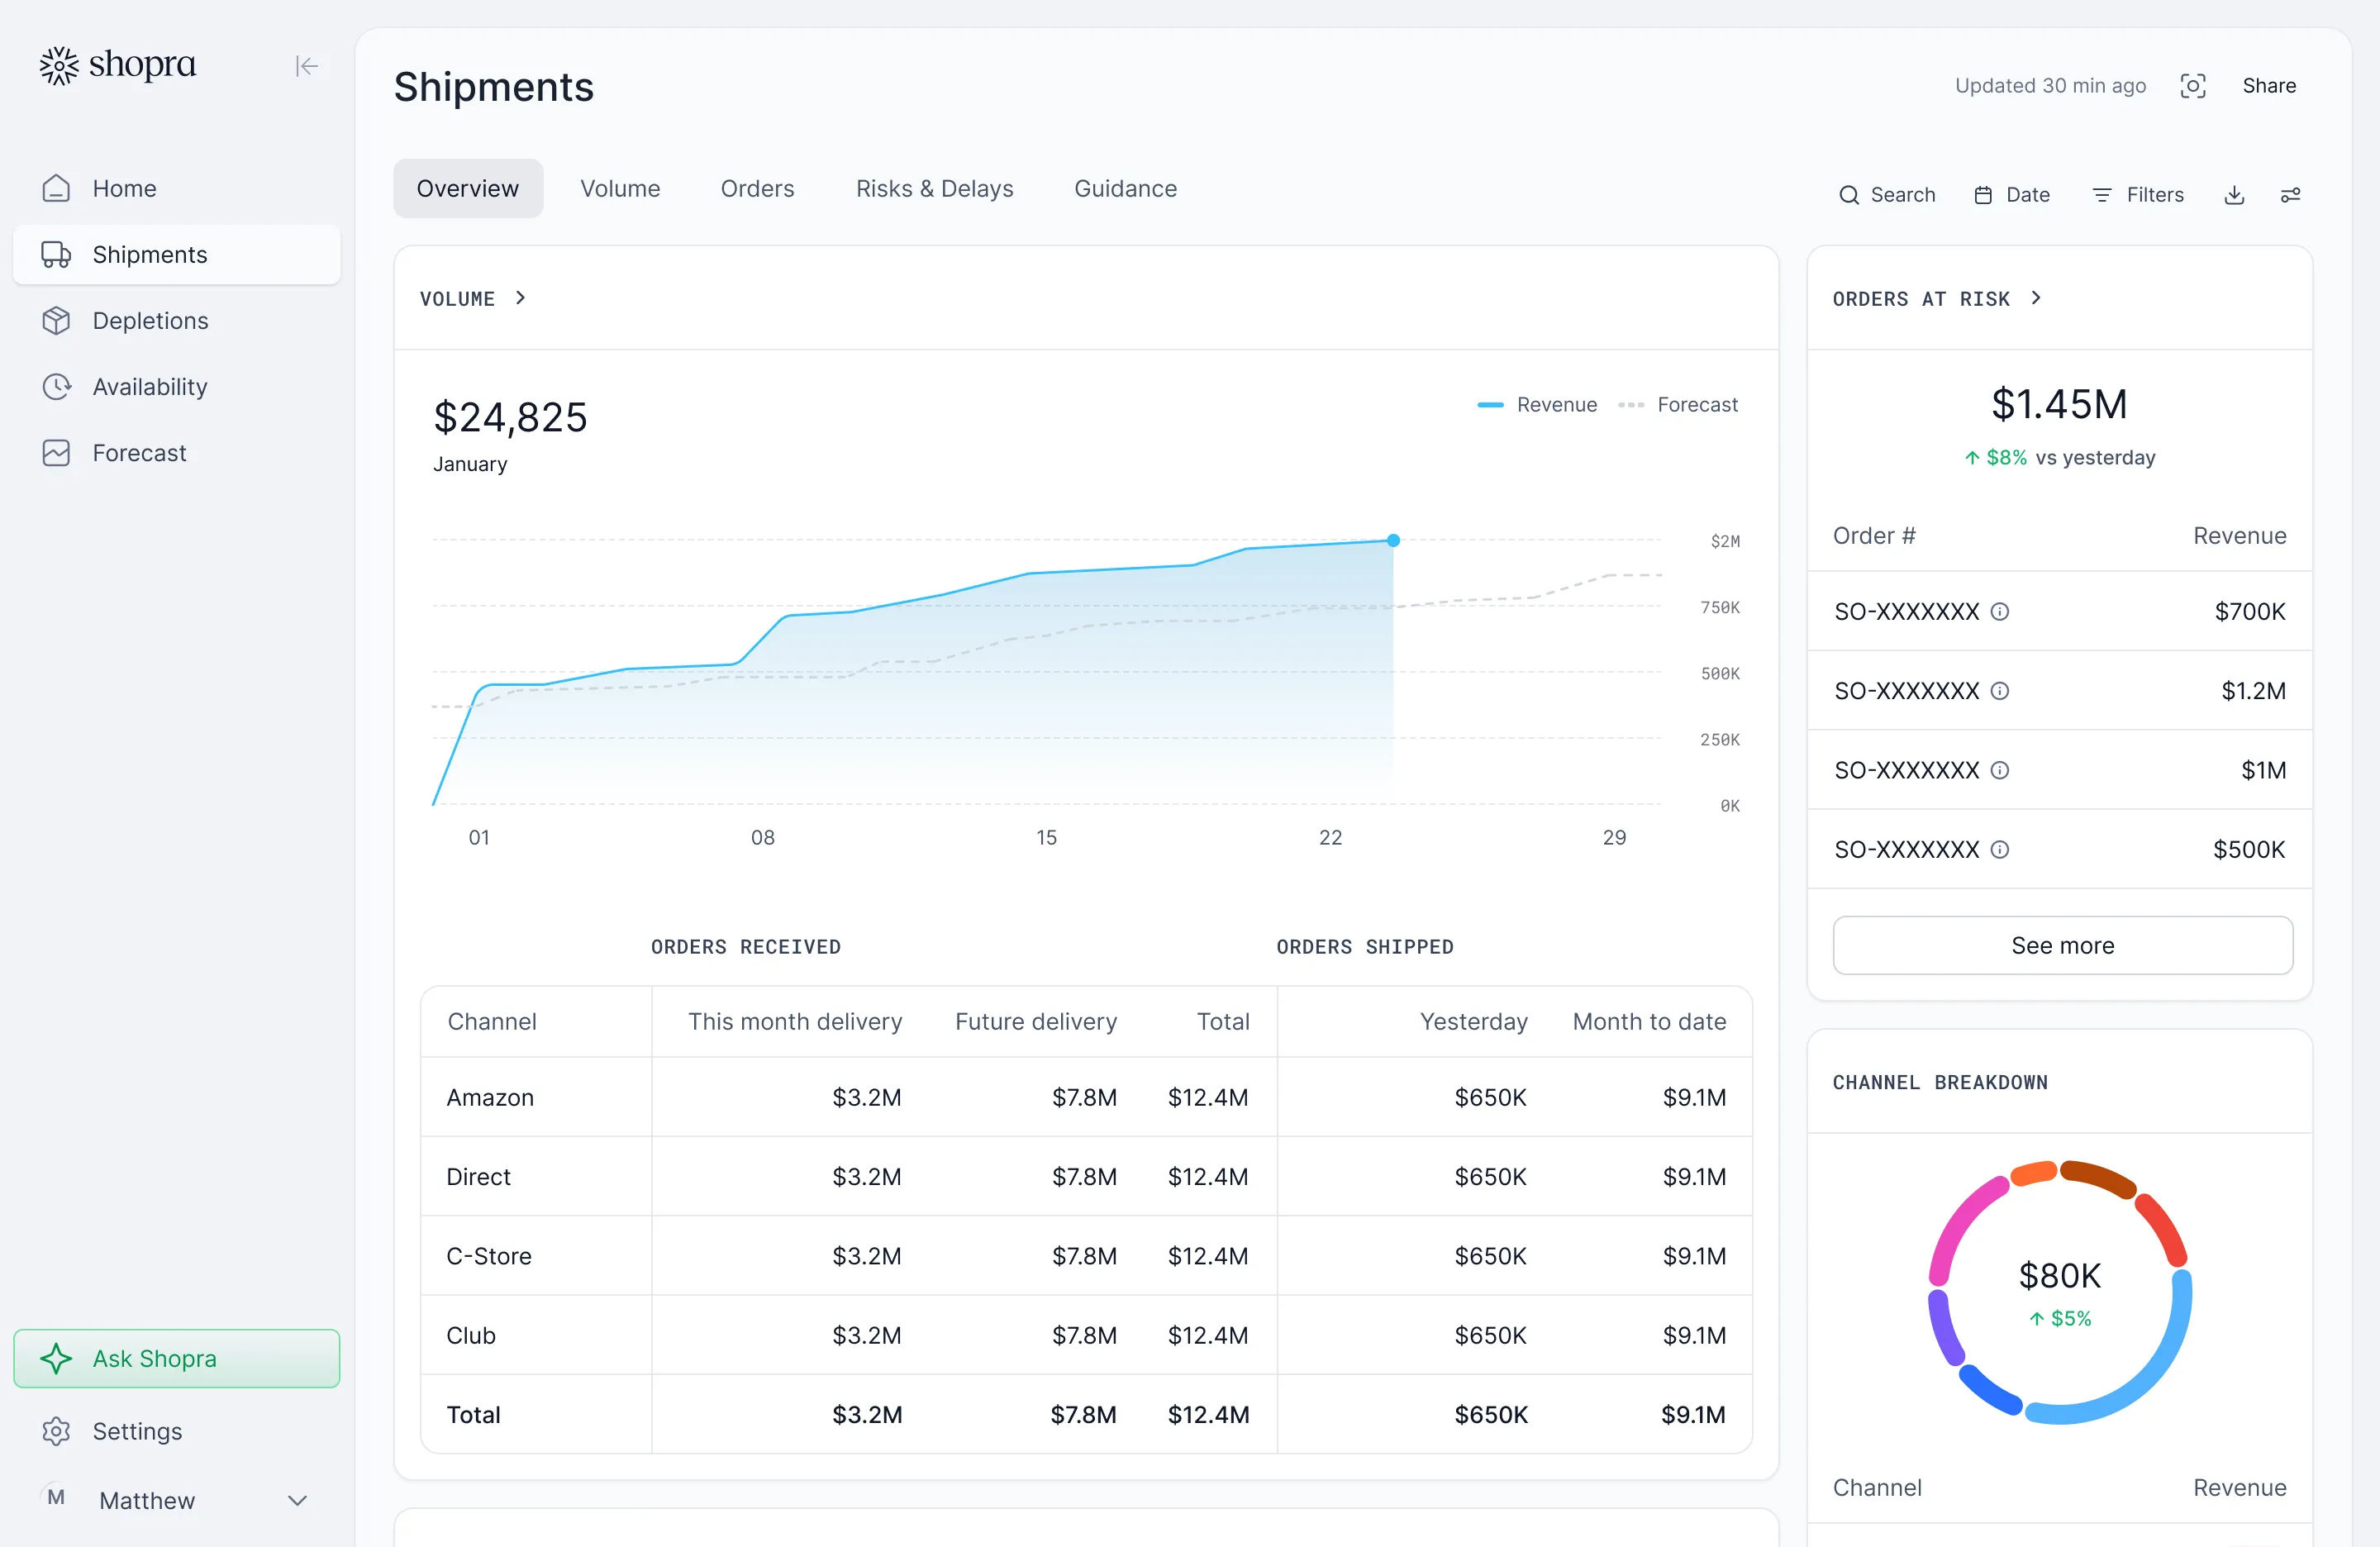
The template is a tracker, not a forecast: every number describes something that already happened. When pasting files every week stops being worth it, Shopra reads your distributor depletion feeds and retail scan directly and keeps this view current for every SKU, distributor, and account.
Frequently asked questions
Is the template really free?
Yes. Enter your name, work email, and company, and the download link appears right away. Change it and share it with your team. It has no macros and needs no Shopra account.
Does it work in Google Sheets?
Yes. Upload the .xlsx to Google Drive and open it with Google Sheets. The formulas use standard functions such as SUMIFS, VLOOKUP, and INDEX/MATCH.
What is a case equivalent (CE)?
A case equivalent is a standard volume unit that makes different pack sizes comparable, commonly 288 fluid ounces, the volume of 24 12-ounce cans. Set CE per case to 1.00 in Setup if you do not normalize volume.
Can I track more SKUs and distributors?
Yes. Add SKUs and distributors on Setup, paste more rows into the source tabs, and add one Tracker row per week per SKU. The formulas cover up to about 5,000 rows.
Does the tracker forecast demand?
No. It only describes what already happened. The flags show where inventory is out of line with the depletion rate you have already recorded, not what will happen next quarter.
Integrations
Connect the sources you already run on.
Shipments, depletions, distributor inventory, and retail scan flow in through a mix of near real-time integrations and 24-hour SFTP exports and ingestion, including VIP and Encompass, plus API access and a fast agent backend for querying.


Your data stays yours. Enterprise plans can run on a dedicated Google Cloud warehouse you own.
ready when you are
Turn your data into your next move
See your drivers, your drags, and where to act today.
Get a demo